| Home | Software | Example Cases | Contact | Bio |
Cone at 0.0 Degrees Alpha and Beta
In this example inviscid 2D cone results for AT CFD, PANAIR, and theory (NACA TR 1135, pdf) are compared. Two sets of results are shown. The first set presents a comparison between AT CFD and theory and the second set compares AT CFD and PANAIR.
The comparison of these results follow in parallel to those presented for the wedge. The wedge results should be viewed before the cone results. In general the trends for the wedge and cone results are similar, except the cone trends are not as pronounced because of the 3D relieving effects.
Comparision of Theory and AT CFD
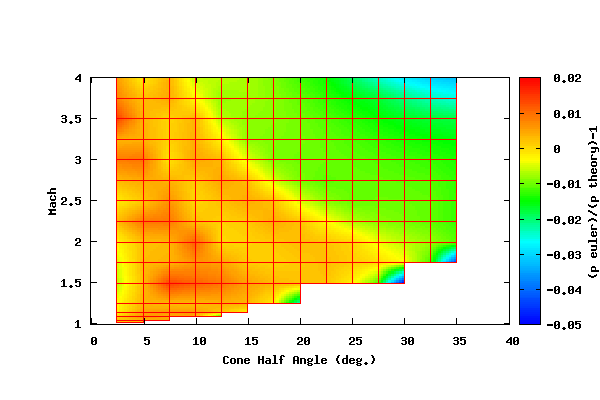
The figure below shows the contour plot of [(p_Euler/p_theory)-1.0] vs. the cone half angle (x axis) and vs. the Mach number (y axis). The average forward face pressure for the AT CFD Euler result is represented by p_Euler and the face pressure calculated by a numerical method based on the oblique shock equations given in NACA TR 1135 is represented by p_theory. The results were calculated for Mach numbers between 1.0 and 4.0 and cone half angles between 2.5 and 35 degrees. The blanked out area in the lower right portion of the plot is the region for which the shock is detached.
As with the wedge, at lower supersonic Mach numbers and lower half angles (low values of Mθ) the results compare well and as the Mach number and half angle increase, the results deviate. As the comparison approaches the region where the shock is detached, the results also deviate.
Comparision of PANAIR and AT CFD
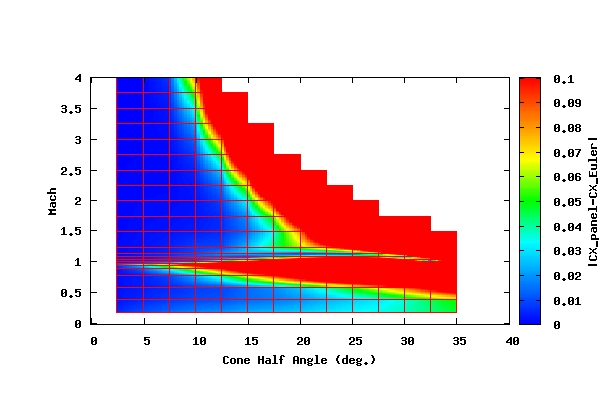
The following contour plot attempts to compare the axial force coefficient (CX) predicted by AT CFD and PANAIR. CX has been non-dimensionalized by the cone base area.
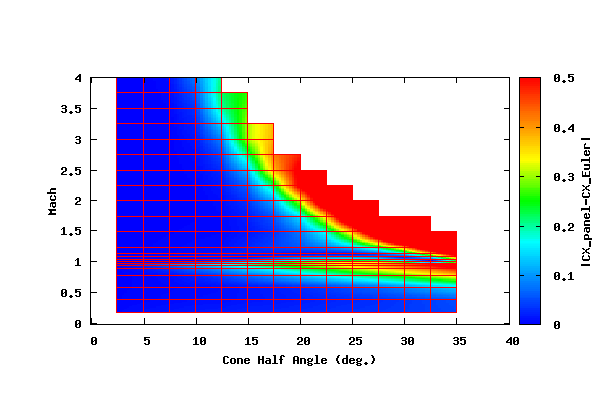
The plot above shows the absolute value of the difference between the CX calculated by PANAIR and AT CFD vs. the half cone angle (x axis) and vs. the Mach number (y axis). The results were calculated for Mach numbers between 0.2 and 4.0 and cone half angles between 2.5 and 35 degrees. The blanked out area in the upper right portion of the plot is the region for which the Mach wave from the cone tip lies inside the cone. Under these conditions the PANAIR methodology is not valid.
It can be seen from the plot above that the error increases in the transonic region and when the Mach and half angle (Mθ) increase.
To give a better idea of the error, the following plot is the same as the plot above except that it limits the contour range from 0.0 to 0.1.