| Home | Software | Example Cases | Contact | Bio |
2D Wedge at 0.0 Degrees Alpha
In this example inviscid 2D wedge results for AT CFD, PANAIR, and theory (NACA TR 1135, pdf) are compared. Two sets of results are shown. The first set presents a comparison between AT CFD and theory and the second set compares AT CFD and PANAIR.
Comparision of Theory and AT CFD
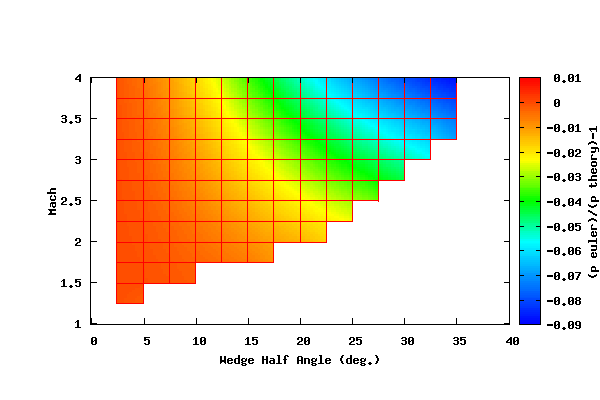
The figure below shows the contour plot of [(p_Euler/p_theory)-1.0] vs. the wedge half angle (x axis) and vs. the Mach number (y axis). The average forward face pressure for the AT CFD Euler result is represented by p_Euler and the face pressure calculated by a numerical method based on the oblique shock equations given in NACA TR 1135 is represented by p_theory. The results were calculated for Mach numbers between 1.0 and 4.0 and wedge half angles between 2.5 and 35 degrees. The blanked out area in the lower right portion of the plot is the region for which the shock is detached.
As can be seen from the figure above, at lower supersonic Mach numbers and lower half angles (low values of Mθ) the results compare well. As the Mach number and half angle increase, the results deviate. At the moment, the cause is unsubstantiated. Plausible causes could be an error, griding, or the wall slip boundary condition. To examine this further, the pressure contours from AT CFD for M=4.0 and a half angle of 35 degrees is shown below.
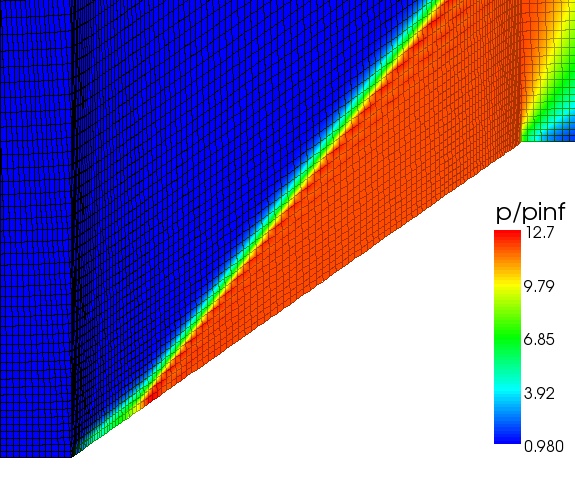
As can be seen from the figure above, the grid leaves much to be desired. (The grid is a result of the automated process used to create the solutions.) Ideally, the grid should be smoother and with better volume distribution. For the figure above it can be seen that the lower average face pressure of the Euler result (as compared to theory) is a result of the low pressures at the leading edge of the wedge. One way to fix this, or cover the symptom, is to increase the grid density at the leading edge. However, the actual cause for the low pressure may be attributed to the boundary condition. The slip boundary condition enforced on the surface is simple. The methodology used takes the pressure and density one grid point off the surface and applies it to the surface point. It also takes the velocity one grid point off the surface, subtracts out component normal to the wall, and applies it to the surface point. Two errors result from this methodology. First, and probably foremost, the pressure is not a function of the change in velocity (i.e. momentum). Also, enthalpy is not constant, even though the case is adiabatic and the shaft and viscous work is zero. The enthalpy plot can be seen here.
The figure below shows the entropy change from freestream.
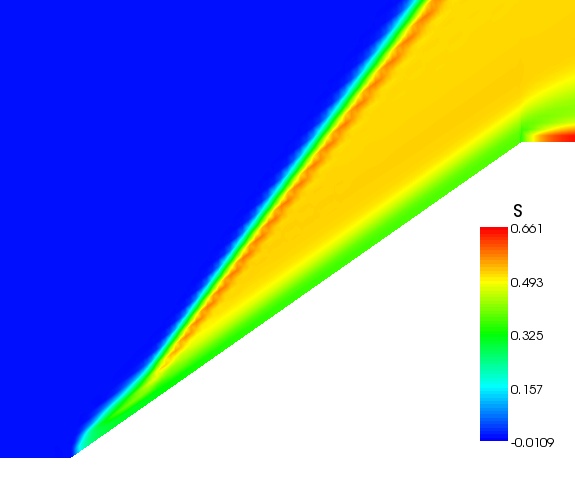
From theory we expect the entropy change for the entire region behind the shock to be constant. Well, at least up to the stream line which crosses the point at which the shock intersects with the shoulder expansion wave. Theoretically, the entropy layer on the wedge forward face and the entropy change through the wedge shoulder expansion wave seen in the figure should not exist.
Comparision of PANAIR and AT CFD
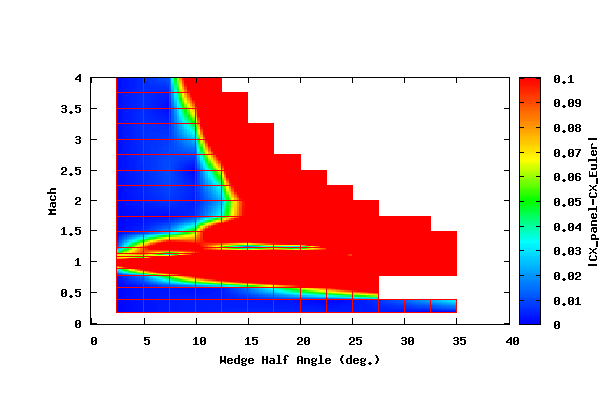
The following contour plot attempts to compare the axial force coefficient (CX) predicted by AT CFD and PANAIR. CX has been non-dimensionalized by the wedge height. The plot is more qualitative than quantitative. Unfortunately, I couldn't come up with a good way to compare these results. The difficulty is that at subsonic speeds the average pressure is intrinsically close to one. Therefore a ratio of the pressures at subsonic speeds is not very informative. And a ratio of the axial force coefficients is misleading since the axial force coefficients are close to zero.
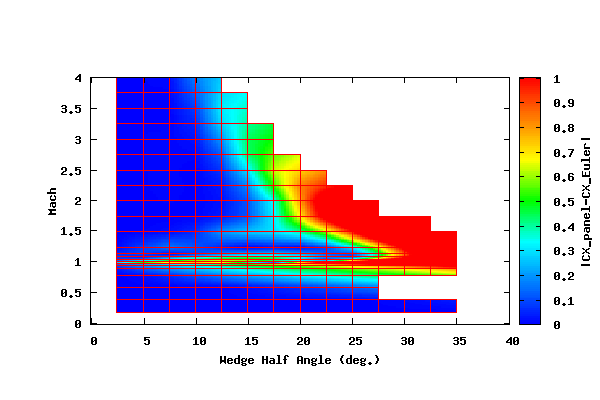
The plot above shows the absolute value of the difference between the CX calculated by PANAIR and AT CFD vs. the half wedge angle (x axis) and vs. the Mach number (y axis). The results were calculated for Mach numbers between 0.2 and 4.0 and wedge half angles between 2.5 and 35 degrees. The blanked out area in the upper right portion of the plot is the region for which the Mach wave from the wedge tip lies inside the wedge. Under these conditions the PANAIR methodology is not valid. The results between a half angle of 27.5 and 35.0 degrees for a Mach of 0.6 is blanked out since the AT CFD solution is unsteady.
It can be seen from the plot above that the error increases in the transonic region and when the Mach and half angle (Mθ) increase.
To give a better idea of the error, the following plot is the same as the plot above except that it limits the contour range from 0.0 to 0.1.