This example case represents an effort to compare AT CFD to data from the 4th AIAA CFD Drag Prediction Workshop. Since AT CFD's current (Oct. 24th, 2011) capability in regards to hole punching, integration of loads on overlapping surface grids, and grid interpolation of points close to the surface is limited, Boeing's ZEUS/CFL3D grid was used D1-3A_DPW4Presentation_Grids.pdf. Due to resource limitations, only the coarse grid could be analyzed.
After all the dust settled, the angle of attack for a CL of 4.999045e-01 on the coarse grid was 2.4153 degrees. The total CD was 2.820e-02, the total pressure CD was 1.565e-02, and the total viscous CD was 1.255e-02. The total pitching moment coefficient (Cm) was -4.292e-02. These results, along with those presented below, can be compared to those in the DPW-IV Summary of Participants' Data and those in the CFL3D results. The CD results for CFL3D with full N-S and an SA turbulence model on a coarse grid is about 2.788e-2 and therefore AT CFD is about 3.2 drag counts higher, which is 1.14% higher than CFL3D. Is this good or bad? I do not know. Ideally, I would have liked to compared the angle of attacks. That information was not provided in the CFL3D presentation. However, the ONERA-elsA presentation states an angle of attack of 2.35 degrees. Therefore, AT CFD may be predicting a slightly higher angle of attack for a CL of 0.5.
The numerical results for AT CFD are provided below.
Aerodynamic Coefficients for the Wing-Body-Horizontal Tail geometry at α=2.4153, M=0.85, Re=5.0e6, SA Turb Model on the coarse grid for Sref=594720.0, Lref=275.8, Xmom=1325.9 and Zmom=177.95 are:
| CX | CZ | CD | CL | Cm | |
| Total | 7.112344e-03 | 5.006491e-01 | 2.820449e-02 | 4.999046e-01 | -4.291806e-02 |
| Pressure | -5.444599e-03 | 5.004367e-01 | 1.564976e-02 | 5.002216e-01 | -4.457130e-02 |
| Viscous | 1.255694e-02 | 2.122533e-04 | 1.255473e-02 | -3.171128e-04 | 1.653220e-03 |
Aerodynamic Coefficients for the Body only at α=2.4153, M=0.85, Re=5.0e6, SA Turb Model on the coarse grid for Sref=594720.0, Lref=275.8, Xmom=1325.9 and Zmom=177.95 are:
| CX | CZ | CD | CL | Cm | |
| Total | 8.571250e-03 | 6.026394e-02 | 1.110329e-02 | 5.984919e-02 | 5.344304e-02 |
| Pressure | 2.337474e-03 | 6.015200e-02 | 4.870337e-03 | 6.000006e-02 | 5.238152e-02 |
| Viscous | 6.233774e-03 | 1.119201e-04 | 6.232953e-03 | -1.508845e-04 | 1.061506e-03 |
Aerodynamic Coefficients for the Wing only at α=2.4153, M=0.85, Re=5.0e6, SA Turb Model on the coarse grid for Sref=594720.0, Lref=275.8, Xmom=1325.9 and Zmom=177.95 are:
| CX | CZ | CD | CL | Cm | |
| Total | -2.901217e-03 | 4.552971e-01 | 1.628860e-02 | 4.550149e-01 | -1.542685e-01 |
| Pressure | -7.997335e-03 | 4.551931e-01 | 1.119262e-02 | 4.551257e-01 | -1.544032e-01 |
| Viscous | 5.096120e-03 | 1.039168e-04 | 5.095972e-03 | -1.109374e-04 | 1.347379e-04 |
Aerodynamic Coefficients for the Tail only at α=2.4153, M=0.85, Re=5.0e6, SA Turb Model on the coarse grid for Sref=594720.0, Lref=275.8, Xmom=1325.9 and Zmom=177.95 are:
| CX | CZ | CD | CL | Cm | |
| Total | 1.442311e-03 | -1.491195e-02 | 8.126066e-04 | -1.495948e-02 | 5.790737e-02 |
| Pressure | 2.152613e-04 | -1.490837e-02 | -4.132018e-04 | -1.490420e-02 | 5.745039e-02 |
| Viscous | 1.227049e-03 | -3.583560e-06 | 1.225808e-03 | -5.529096e-5 | 4.569766e-04 |
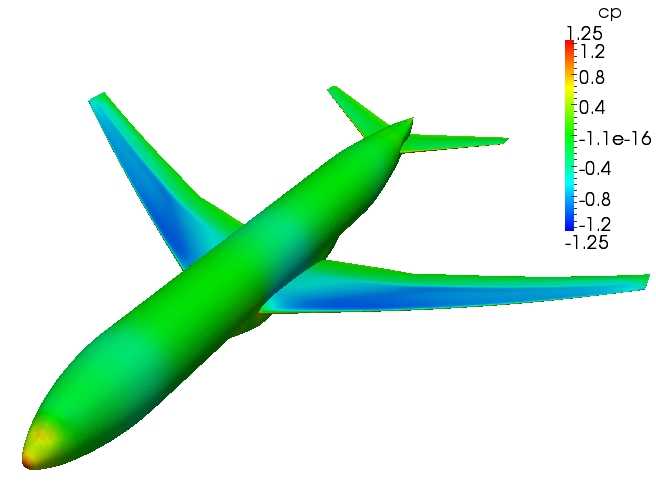
The following image shows the surface pressure for the configuration.
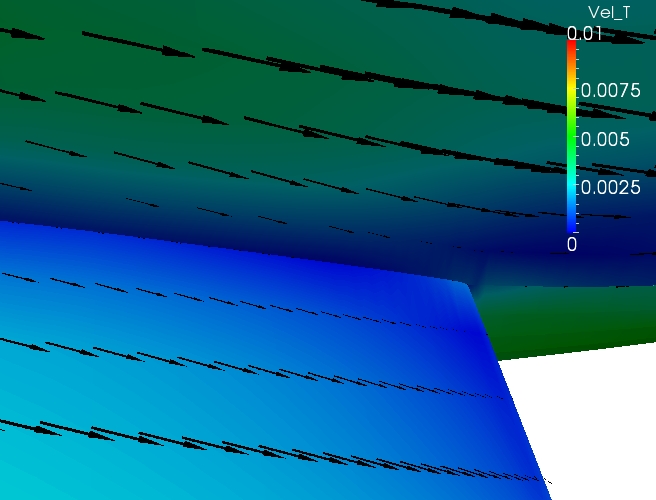
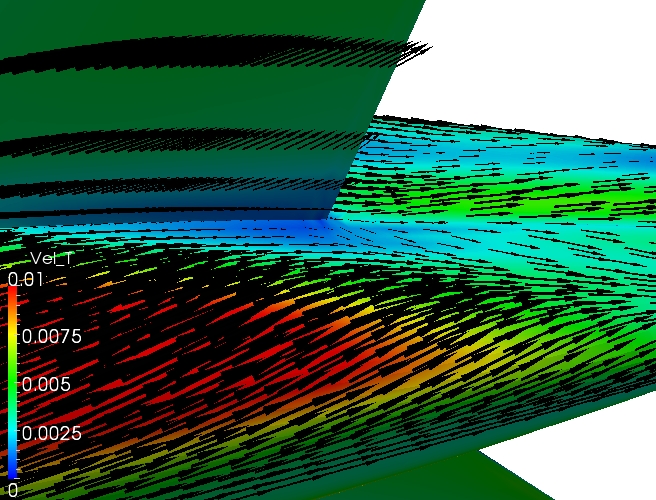
The following image shows the surface flow on the top side of the wing trailing edge..
The following image shows the surface flow on the top side of the tail trailing edge.
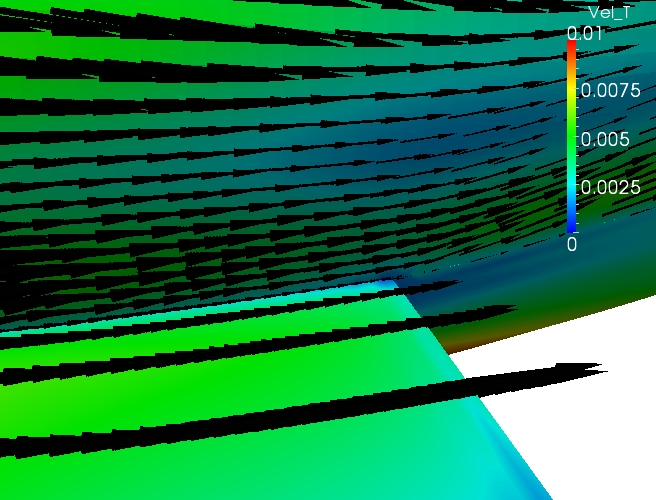
The following image shows the surface flow on the bottom side of the tail trailing edge.
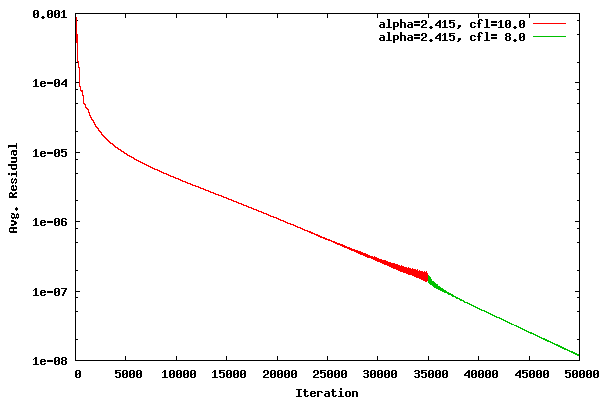
The following plot shows the average residual vs. iteration for the α=2.415 case. The case was started at a CFL number of 10 and then reduced to 8 for further convergence.